
Up Your Gamma with Unusual Option Activity
For most of my career option gamma always led me to think of the risk. Option sellers have a particular risk close to expiration and it’s important to take steps to mitigate that risk. However, that all changed over the past two years as gamma began to be framed as an opportunity. This transition occurred as option traders began buying short-dated out-of-the-money (OTM) call options on high short interest companies. This trend turned the traditional gamma risk of option sellers to the bullish “gamma squeeze” of long options.
GME Gamma Squeeze
A great example of a gamma squeeze was the infamous GameStop Corp (NYSE: GME) short squeeze of 2021. In the chart below, you’ll see how the stock price moved from around $20 to nearly $500 in a couple of weeks. As longs piled in, the shorts were forced to cover, which created a massive movement in such a short period of time.
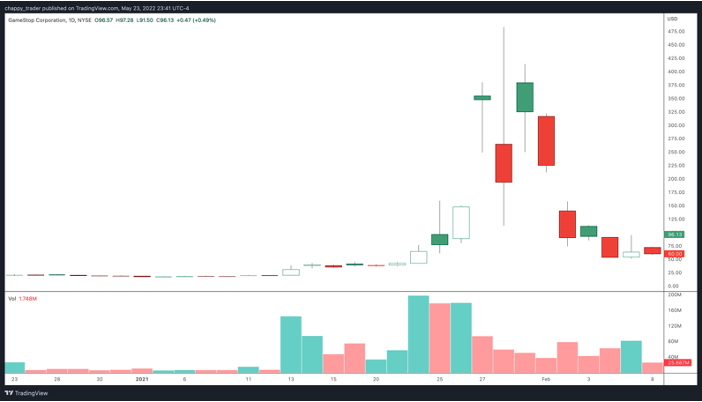
What you don’t see on the chart is the significant role that the options market played in the movement. Nearly every pull-back in the previous several months saw significant long call option activity pick up before the move higher. This added significant fuel to the bullish fire. Eventually, the trading restrictions tempered the stock’s movement and the price quickly fell back into the $50 range.
However, the gamma squeeze opportunity created by option buyers didn’t begin or end with GameStop. Every day there are large option trades being made that have the potential to create movement in the price of the stock. Using unusual option activity can give you a unique perspective on where the opportunity is in the market each day.
Let’s take a closer look at unusual option activity and its role in adding gamma to your trades.
What is Unusual Option Activity (UOA)?
Hopefully, the above example has caught your attention. It sounds great, but what is it and how do you find these types of opportunities?
First, unusual option activity can be defined by seeing above-average volume on the options. You can compare the day's call or put volume against the 5-day average to see that the level of activity is above average.
Another consideration is to identify high call or put volume on a particular strike price. Typically seeing at least 2,000 contracts traded on a strike can be significant. However, volume only tells half of the story. What we’re wanting to identify is opening option interest. That means that the volume needs to be greater than open interest. Since volume is updated in real-time and open interest is updated at the end of the day, volume that is greater than open interest helps you know that new trades are being opened instead of closed.
Finally, you can use option time and sales data to see if there are any large prints. For example, if 10,000 contracts were filled in one trade at $2.00 (at the ask price), that means someone put down $2 million in one trade. Institutions frequently trade large blocks of contracts like that. If the volume is greater than the open interest, then you really have something.
UOA & Gamma
What is the impact of such a large trade? It’s unlikely that a 10,000-contract order can be matched with another trader. As a result, market makers will end up taking the other side of the trade. If it was a long call trade, that means that the market maker may be short a lot of those calls. If it was a long put, they would be short the puts.
Having a lot of long or short delta isn’t optimal for a market maker. That means they need to hedge their risk by going long stock to hedge the short calls or short stock to hedge their short puts. The impact of hedging activity can’t be understated. Frequently, the stock price will surge on higher volume as large orders are getting filled. This is either hedging or the trader is simultaneously trading the stock in the direction of the option trade.
One thing about hedging is that the directional risk isn’t constant with options. That means as an option moves at-the-money (ATM) or in-the-money (ITM), the delta risk increases. As a result, the option maker will need to offset the risk further by going even more long or short the stock. Voila! We have achieved a gamma squeeze! This feedback loop only further enhances the potential movement in the stock price.
UOA & the Trade
As a trader, you need three things: direction, target, and timeframe. All of this can be supplied through unusual option activity.
When an option is traded, you have a strike price, expiration, and whether it was a call or put. For example, if a $30 put was bought for $3.00 and expires in two weeks, you have all of the information you need. If the stock price is $33, meaning the $30 strike price is out-of-the-money (OTM), your target price is $30. Since the option is expiring in two weeks, you know that is the timeframe for the expected move.
While the UOA trade gives you all the information you need, you aren’t necessarily going to make the same trade. You may prefer to buy more time, construct a spread to capitalize on the volatility skew, or even trade the stock. That means that you’re not abandoning what you do best. The UOA is just directing your efforts to focus on stocks with potential and providing key information for the trade.
UOA & Insider Trading
Many people ask if the trade is based on insider trading. That can be the case but is most often based on the analysis being made by the institution or even just a hedge for a position.
An example of potential insider trading was on Frequency Therapeutics, Inc. (NASDAQ: FREQ) on March 22, 2021. On that day, there were 3,000 contracts traded on an April 2021 10/7.50 long put vertical. For an illiquid stock like FREQ, it was a rather large bearish trade. I saw the trade on that day and had a chance to discuss it during my daily chat room session on TheoTrade.
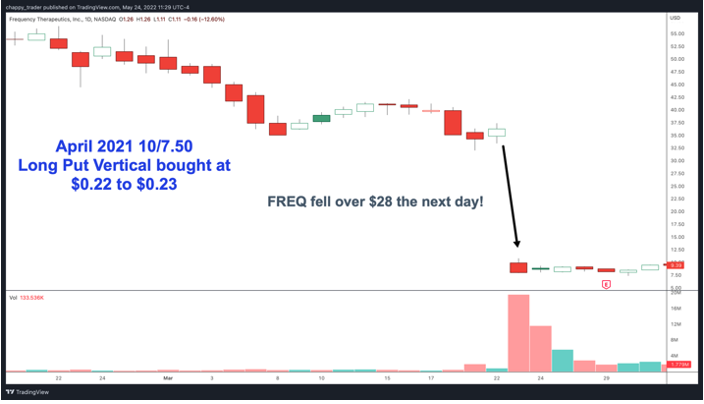
With the stock trading near $36, it seemed almost unfathomable that the stock could reach $7.50 in a matter of weeks. I had assumed that maybe someone knew the earnings could be disappointing. However, the company had a preannouncement the next day and the stock reached an intraday low of $7.91! Was it good timing or was it foreknowledge?
The great thing is that you’re not relying on insider trading in order to realize the potential gamma squeeze. However, it can be nice when it works out that way!
Conclusion
How do you find the stocks that you’re trading? Do you have a repeatable process that allows you to flow with the market? Incorporating unusual option activity into your routine will help you find where the money is moving in the market and add gamma squeeze potential. This is accomplished by identifying large institutional option trades and using the direction, timeframe, and magnitude of movement the trade provides. Hopefully, the information in this post starts you on the path to adding more gamma squeeze potential to your trading.