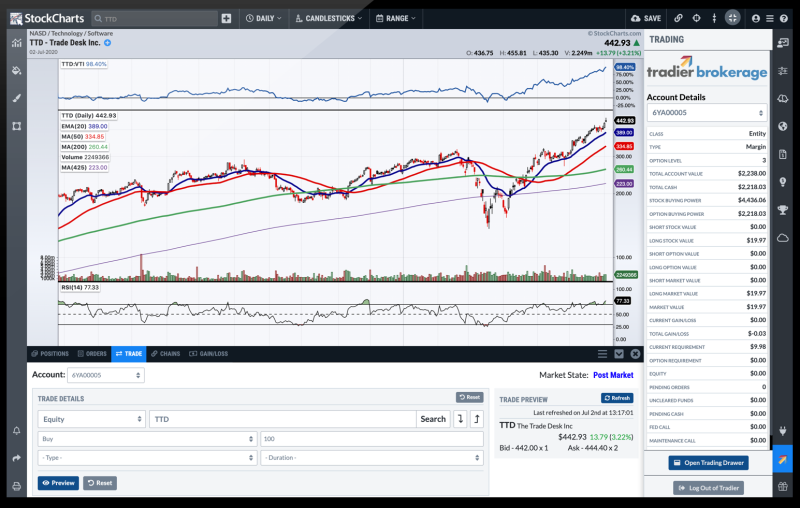
Example stock chart from StockCharts Advanced Charting Platform with Tradier Brokerage integration.
As a first-time trader or investor, it can be hard to make decisions about what to buy, sell, and when to pull the trigger. The art and science of reading stock charts, known as charting, is an excellent skill to have that can help you make those tough decisions.
Let’s start with the basics: what a stock chart is. A stock chart gives you a visual snapshot of all the important information an investor needs to know about a stock’s performance. This includes:
- The 10- and 40-week moving average: These lines track the stock’s share price movement over a period of time.
- The relative strength line: This line compares the stock’s performance to the performance of the S&P 500.
- The share price of the stock.
- The volume of stock that was traded.
All of these bits of information combine to tell you a story about that stock’s performance. They become especially useful when you look at both a stock’s daily chart and weekly chart. The weekly chart can help you understand trends in the stock’s share price and helps you stay grounded with a well-rounded picture of a stock’s performance. The daily chart is like the play-by-play of a stock’s performance throughout the day and can be especially useful for time-sensitive moments like the day of a breakout.
So why would you want to learn to read stock charts? As a first time investor, we know that the market can seem frustratingly opaque and it’s easy to panic at a sudden price swing or bear-ish market day. The current stock market is especially vulnerable to news-based swings that have little to nothing to do with the actual value of the underlying stocks.
The ability to read and understand stock charts can help you understand the swings and stay grounded in an understanding that’s based on facts about the stock’s performance, not headlines or opinions about the market. Stock charts are the perfect research tool for learning about and being able to predict a number of important factors that should influence your decision to buy or sell.
- Past and present instability in the share price. Price instability isn’t necessarily a bad thing but having an understanding that you are buying a stock with a history of price instability is always a good thing especially during market fluctuations. On the flip side, if your research tells you that the share price is typically stable you will have a better reason to look at selling if there’s a period of instability in the share price.
- How well the stock performs compared to the overall market. Everyone is looking for a stock that can beat the market. Studying a stock’s chart is the best way to find one.
- How important events and market fluctuations impact the stock’s value. When you have a long-term investment strategy, you will be holding stocks for a while. Understanding how they perform after important events or market fluctuations can go a long way to helping ease your mind and keep you grounded after an upsetting market swing.
- History of volume and trading levels. Are institutional investors sweeping up as many shares as possible or dumping them as fast as they can? Does the stock plateau and climb regularly or does it always hit a ceiling and drop? These are important things to know when developing an investment strategy and a stock chart can tell you both of them.
With Tradier, you have access to the web's most advanced, interactive financial charting platform: StockChartsACP. This platform allows you to see all the relevant stock charts and data easily. Combined with Tradier’s investment platform, you can then go ahead and make your trades all in one place. Nothing could be simpler.