Understanding volatility and how it impacts options prices is very important to becoming a profitable options trader. Historical Volatility (HV) and Implied Volatility (IV) are two common ways of measuring the volatility of a stock.
Today we'll show you the differences between HV and IV so you are better equipped to build a winning options trading system.
What is Historical Volatility?
Historical Volatility is a backward-looking metric that looks at the fluctuation of recent stock prices. We can use HV to understand whether a stock has been volatile in recent trading days. Let’s use FB as an example to show you how HV is calculated.
The first step is to take the closing prices of the last month. Then we calculate the daily change, by dividing the closing price by the preview closing price - 1. As a result, we get a table of the data within the last month for FB.
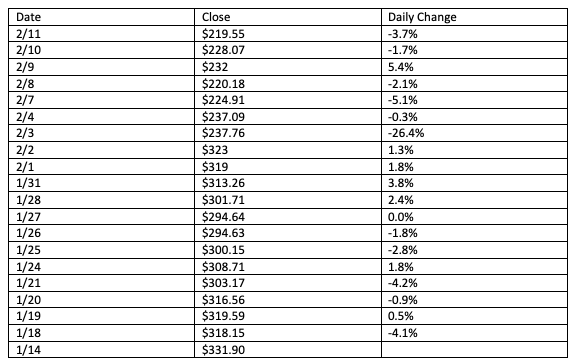
Then we can take the standard deviation of the daily change to get 6.6%.
Since there are 252 trading days a year, we convert the standard deviation of 6.6% to an annualized value using the formula, 6.6% * square root (252) = 104%. We can see HV is a statistical measure of the dispersion of a stock’s daily change.
Therefore, the higher HV is, the greater the dispersion or volatility a stock has been.
What is Implied Volatility?
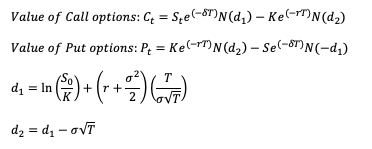
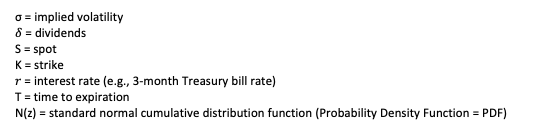
Implied Volatility (IV) is the forward-looking volatility of a stock, and it helps options traders project the volatility of the underlying in the near future. Unlike HV which uses past price data to calculate volatility, IV is derived from options prices. A common option pricing model is the famous Black Scholes model and it calculates options prices using the following inputs:
- Implied Volatility
- Dividends
- Interests
- Time
- Stock price
- The strike price for the options
N(d2) is the probability that the stock price is above the strike price at expiration.
N(d1) is the expected value of cash/stock inflow at expiration only if the stock price is above the strike price.
If we start with the AAPL ATM $150 Call option as $5.067. We can use the Black Scholes model to deduce the IV.
Stock price (S) = $151.28
Strike price (K) = $150.00
Interest rate = 0.04%
Time to expiration (T) = 39 days / 365 days = 0.106849
The Call option value of $5.067 can be expressed as the formula below.
So, we have to do some trial and error to approximate the IV value to match the Call price.
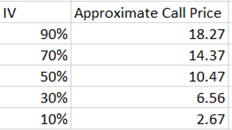
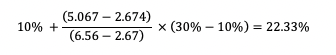
We see the IV between 10%-30% give results close to $5.067.
Now, we will apply interpolation to get the implied volatility for a $5.067 ATM Call option.
Now you have a better understanding of how volatility and options prices relate to each other.
You can use IV to estimate the trends of option values and sell high return neutral strategies during high IV. Then buy to close when IV is low.